In the case that you are experiencing a slow server, or intermittent timeouts/disconnects, you may not know where to start investigating. If you are a business owner, you should rely on your System Administrator. If you are the admin, (or you don’t have an admin 😱), you may run to your web hosting/server provider.
In order to investigate the issue to the highest degree, it’s important to diagnose the issue properly. Iperf, MTR, and TCP Traceroute are all network diagnostic tools that serve different purposes, and the choice of which tool to use depends on the use case and the type of problem you’re trying to diagnose.
Iperf is primarily used to measure network bandwidth and throughput, and it does this by generating TCP or UDP traffic between two hosts and measuring the resulting data transfer rate. It’s useful for testing network performance and identifying bottlenecks.
MTR (My Traceroute) is a tool that combines the functionality of the traditional traceroute and ping tools, providing both network path information and network latency information. It sends a sequence of packets to a target host and displays the response time for each hop along the route, as well as the percentage of packet loss at each hop. It’s useful for identifying network latency and packet loss issues and locating points of network congestion.
TCP Traceroute is similar to MTR, but instead of using ICMP packets like MTR, it uses TCP SYN packets to trace the network path and measure the latency and packet loss. It’s useful for identifying network path issues that may be specific to TCP traffic, such as when a firewall or other network device is blocking TCP traffic.
In general, if you’re interested in measuring network bandwidth and throughput, iperf is the appropriate tool to use. If you’re interested in measuring network latency and packet loss, MTR or TCP Traceroute may be more appropriate. If you suspect that a network path issue may be specific to TCP traffic, TCP Traceroute may be the better choice. If you’re not sure, run all three!
A Prelude on MTR
In order to investigate the full pathway of network transit, it’s important to run the MTR test both from your home PC to the troublesome server, and also from the server to your PC.
If only one hop has 100% data loss, but either end-point is fine, it is likely because it is hidden due to being on the edge of a datacenter.
The MTR test will take ~17 minutes each way.
MTR on Windows Home PC or Windows Server
Installation
Download WinMTR from here:
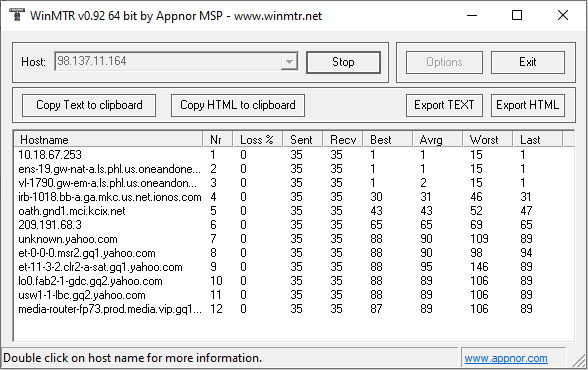
Usage
Enter the IP address of the server/PC in the box, then let it run for at least 1000 packets.
MTR on Debian/Ubuntu/Kali/Raspbian:
Installation
sudo apt update && sudo apt install mtr-tiny
Usage
mtr -r -c 1000 1.2.3.4 >mtr-results.txt
Replace 1.2.3.4 with your server’s IP address.
MTR on Fedora/RHEL/CentOS Stream/Rocky Linux:
Installation
sudo dnf update && sudo dnf install mtr
Usage
mtr -r -c 1000 1.2.3.4 >mtr-results.txt
Replace 1.2.3.4 with your server’s IP address.
MTR on openSUSE/Tumbleweed:
Installation
sudo zypper refresh && sudo zypper install mtr
Usage
mtr -r -c 1000 1.2.3.4 >mtr-results.txt
Replace 1.2.3.4 with your server’s IP address.
MTR on Mac:
Installation
Install Homebrew, a package manager for Mac, by running the following command in Terminal:
/bin/bash -c "$(curl -fsSL https://raw.githubusercontent.com/Homebrew/install/HEAD/install.sh)"
Once Homebrew is installed, use the following command to install MTR:
brew install mtr
Usage
mtr -r -c 1000 1.2.3.4 >mtr-results.txt
Replace 1.2.3.4 with your server’s IP address.
TCP Traceroute on Windows Home PC or Windows Server
Installation
To install TCP Traceroute on Windows, you will first need to install the Npcap library from here:
Npcap: Windows Packet Capture Library & Driver
Then, you can grab the latest version of TCP Traceroute (v1.0.3 released in 2016) here:
Usage
Open up command prompt in the side directory that you’ve extracted TraceTCP (or cd into the directory) and run:
tracetcp 1.2.3.4:567
Replace 1.2.3.4 with your server’s IP, and 567 with the port you’re trying to connect. For example, port 443 for https.
TCP Traceroute on Debian/Ubuntu/Kali/Raspbian:
Installation
sudo apt update && apt install tcptraceroute
Usage
tcptraceroute 1.2.3.4 567
Replace 1.2.3.4 with your server’s IP, and 567 with the port you’re trying to connect. For example, port 443 for https.
TCP Traceroute on Fedora/RHEL/CentOS Stream/Rocky Linux:
Installation
sudo dnf update && sudo dnf install tcptraceroute
Usage
tcptraceroute 1.2.3.4 567
Replace 1.2.3.4 with your server’s IP, and 567 with the port you’re trying to connect. For example, port 443 for https.
TCP Traceroute on openSUSE/Tumbleweed:
Installation
sudo zypper refresh && sudo zypper install tcptraceroute
Usage
tcptraceroute 1.2.3.4 567
Replace 1.2.3.4 with your server’s IP, and 567 with the port you’re trying to connect. For example, port 443 for https.
TCP Traceroute on Mac:
Installation
Install Homebrew, a package manager for Mac, by running the following command in Terminal:
/bin/bash -c "$(curl -fsSL https://raw.githubusercontent.com/Homebrew/install/HEAD/install.sh)"
Once Homebrew is installed, use the following command to install TCP Traceroute:
brew install tcptraceroute
Usage
tcptraceroute 1.2.3.4 567
Replace 1.2.3.4 with your server’s IP, and 567 with the port you’re trying to connect. For example, port 443 for https.
A Prelude on Iperf
In the instructions below, we provide details on how to run both an iperf server on your server with the issue (using the iperf -s flag), in order to test the iperf client on your home PC (using the -c flag).
An alternative is to install the iperf client on your problematic server, and use a public iperf server such as:
- nyfiosspeed1.west.verizon.net
- nyfiosspeed2.west.verizon.net
- dal.speedtest.clouvider.net
Iperf on Windows Home PC or Windows Server:
- First, download the Iperf utility from here:
- Next, open an elevated command prompt on the server that will be receiving data.
- In the command prompt, cd to the directory where iperf exists, and enter the following command:
iperf.exe -s 2mand press Enter. This will start the Iperf server with a TCP window size of 2 MB. - Now, open an elevated command prompt on the client PC that will be sending data.
- In the command prompt, enter the following command:
iperf.exe -c x.x.x.x -t 30s -i 1sand press Enter. Replace “x.x.x.x” with the IP address of the server. This will start the Iperf client and connect to the Iperf server at the specified IP address with a TCP window size of 2 MB. The test will run for 30 seconds and report the results every 1 second. - Once the test is complete, the Iperf client will display the results in the command prompt, including the measured bandwidth and throughput between the two servers.
Iperf on Linux:
- First, download the Iperf utility from the official repo:
cd /usr/srcapt install build-essential gitgit clone https://github.com/esnet/iperf.gitcd iperf./configuremakemake installldconfig- In the case that building fails, run
./bootstrap.shfrom the top-level directory first.
Alternatively, many repos include iperf in their package list, ie.sudo apt update && sudo apt install iperf. If you opt for this option, replaceiperf3withiperfin the commands below.
See more download options at the end. - Next, open an elevated command prompt on the server that will be receiving data.
- In the command prompt, cd to the directory where iperf exists, and enter the following command:
iperf3 -s 2mand press Enter. This will start the Iperf server with a TCP window size of 2 MB. - Now, open an elevated command prompt on the client PC that will be sending data.
- In the command prompt, enter the following command:
iperf3 -c x.x.x.x -t 30s -i 1sand press Enter. Replace “x.x.x.x” with the IP address of the server. This will start the Iperf client and connect to the Iperf server at the specified IP address with a TCP window size of 2 MB. The test will run for 30 seconds and report the results every 1 second. - Once the test is complete, the Iperf client will display the results in the command prompt, including the measured bandwidth and throughput between the two servers.
Iperf on Mac:
- First, download the Iperf utility from here:
- Next, open an elevated command prompt on the server that will be receiving data.
- In the command prompt, cd to the directory where iperf exists, and enter the following command:
iperf -s 2mand press Enter. This will start the Iperf server with a TCP window size of 2 MB. - Now, open an elevated command prompt on the client PC that will be sending data.
- In the command prompt, enter the following command:
iperf -c x.x.x.x -t 30s -i 1sand press Enter. Replace “x.x.x.x” with the IP address of the server. This will start the Iperf client and connect to the Iperf server at the specified IP address with a TCP window size of 2 MB. The test will run for 30 seconds and report the results every 1 second. - Once the test is complete, the Iperf client will display the results in the command prompt, including the measured bandwidth and throughput between the two servers.
Conclusion
In conclusion, if you run these tests and provide the results to your web hosting/server provider along with your issue, you are more likely to have your issue resolved quicker. This is because these tests can help to determine if the issue is with your server, their network, or another network hop.